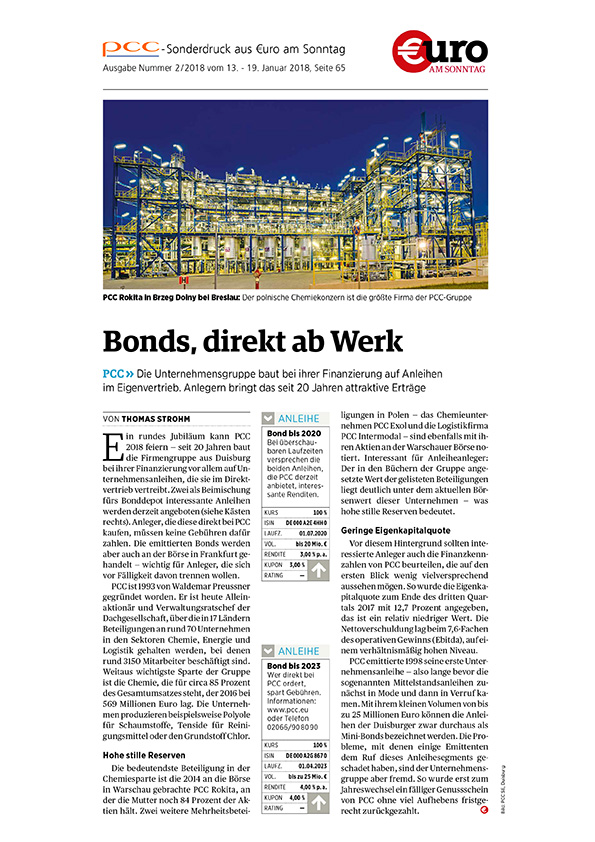
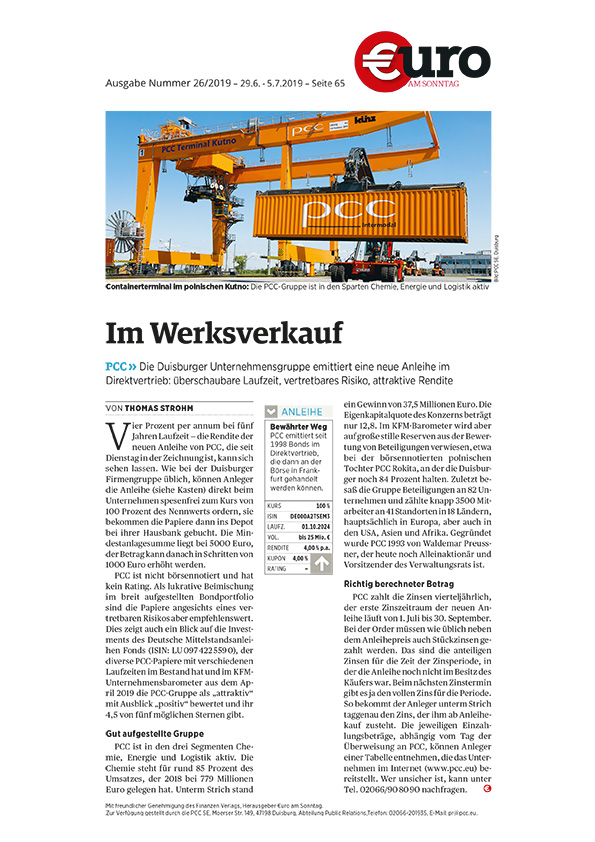
Attractive interest rates: Our current PCC new issues offer you 5.75 % and 4.25 % interest with a term of five years and two and a half years respectively.
Plannable reinvestment: We issue bonds on an ongoing basis. Thanks to our regular issues, you can plan for the long term with our attractive interest rates.
Fee-free Subscription: Subscribe to PCC bonds directly through PCC SE without additional costs. This way you save on brokerage fees.
Quarterly Interest Payments: You receive your interest for PCC bonds at the beginning of each quarter, not just once a year.
Experienced issuer: We know what we are doing: PCC has been issuing bonds since 1998. Over 20,000 investors have subscribed to PCC securities to date.
Stock market listing: Do you need your capital back before the end of the term? Bonds can be sold on the Open Market of the Frankfurt Stock Exchange and on the Regulated Unofficial Market of the Stuttgart Stock Exchange
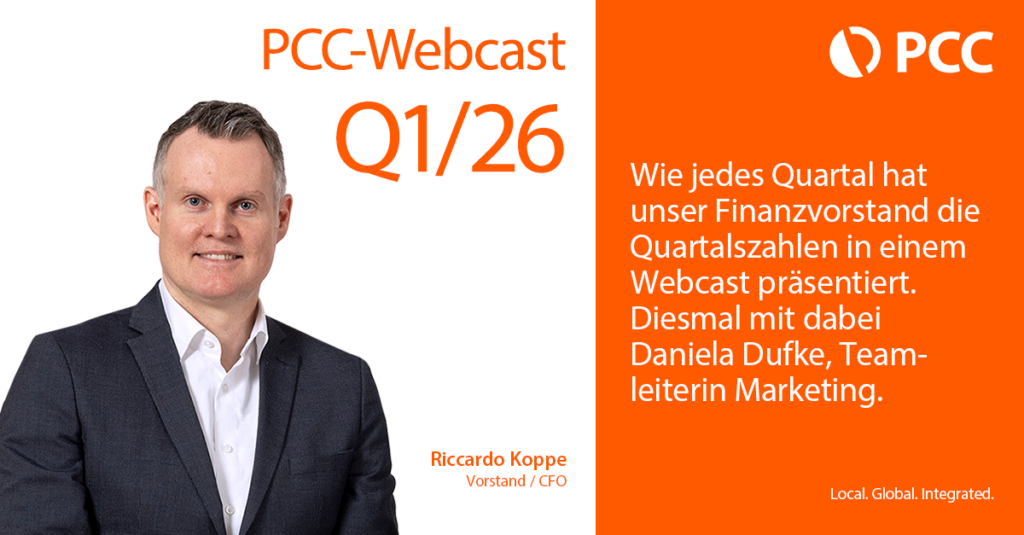
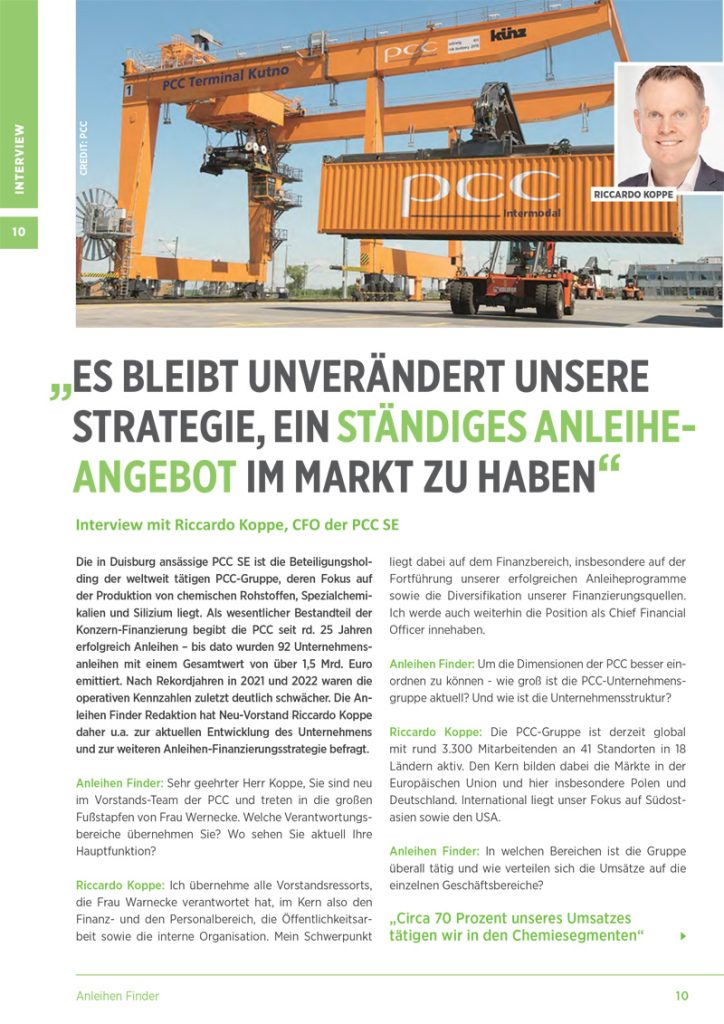
200 viewers took part in our PCC webcast on business performance in the first quarter of 2026 on Thursday, May 21. Riccardo Koppe, Chief Financial Officer / CFO of PCC SE, presented the quarterly figures and then answered questions from the participants.
PCC Group Key Financial Figures
(in accordance with IFRS)
3M/2026*
3M/2025*
2025**
2024**
Revenue (in millions of €)
221.0
251.2
923.6
960.0
Gross Profit (€ million)
73.0
78.6
290.5
292.4
EBITDA (€ million)
13.0
13.4
81.4
88.0
EBIT (€ million)
-7.8
-7.9
-118.3****
1.9
EBT (million €)
-15.5
-32.3
-187.1****
-29.5
Consolidated Net Income (in millions of €)
-17.7
-30.8
-198.7****
-48.0
Consolidated Total Income (in millions of €)
-***
-***
-205.1****
-37.1
Operating Cash Flow (€ million)
13.0
13.5
78.9
82.1
Investments (in millions of euros)
23.0
39.6
173.8
126.5
PCC Group Key Figures (in accordance with IFRS)
March 31, 2026*
March 31, 2025*
December 31, 2025**
December 31, 2024**
Group Equity (€ million)
106.2
324.1
128.9
343.1
Equity Ratio (%)
7.3
19.6
8.9
21.4
Net debt / EBITDA
12.4
10.6
12.0
9.8
Employees
3,428
3,322
3,115
3,295
Rounding errors may occur.
* Quarterly figures are unaudited.
** The key figures as of December 31 are taken from the PCC Group’s audited consolidated financial statements prepared in accordance with IFRS, which have been issued with unqualified audit opinions.
*** Consolidated net income is calculated annually.
**** This item includes an extraordinary impairment charge of approximately €110 million on the silicon metal plant in the Silicon & Derivatives segment.
Key financials PCC SE
PCC SE Key Financial Figures
(in accordance with IFRS)
2025*
2024*
2023*
EBT (million €)
-45.7
-11.2
24.6
Net Loss/Profit for the Year (in millions of €)
-45.7
-12.2
22.6
Equity Ratio (%)
50.1
56.0
60.2
Total Assets (in millions of €)
1,141.1
1,175.5
1,476.1
Fair value of the investment portfolio “
” (in millions of €)
950.1
980.4
1,198.6
- Market capitalization of all listed investments
(in millions of €) **
322.3
348.1
471.0
Investment Portfolio (Number)
66
68
66
Net financial liabilities (in millions of €)
542.0
493.1
525.2
Investments (€ million)***
8.8
5.4
22.4
Employees (as of Dec. 31)***
76
77
74
Rounding errors may occur.
* The financial figures are taken from PCC SE’s audited individual financial statements prepared in accordance with IFRS, which have been issued with unqualified audit opinions.
**Proportional market value of the publicly traded investments in PCC SE’s investment portfolio. Each is valued at the closing price as of the reporting date (Dec. 31) and converted at the exchange rate as of the reporting date (Dec. 31).
You are currently viewing a placeholder content from Google Maps. To access the actual content, click the button below. Please note that doing so will share data with third-party providers.