Attractive Interest Rates: Our current PCC bond offers you 5.50% or 4.00% interest with a term of approximately five years or approximately two years respectively.
Fee-free Subscription: Subscribe to PCC bonds directly through PCC SE without additional costs. This way you save on brokerage fees.
Quarterly Interest Payments: You receive your interest for PCC bonds at the beginning of each quarter, not just once a year.
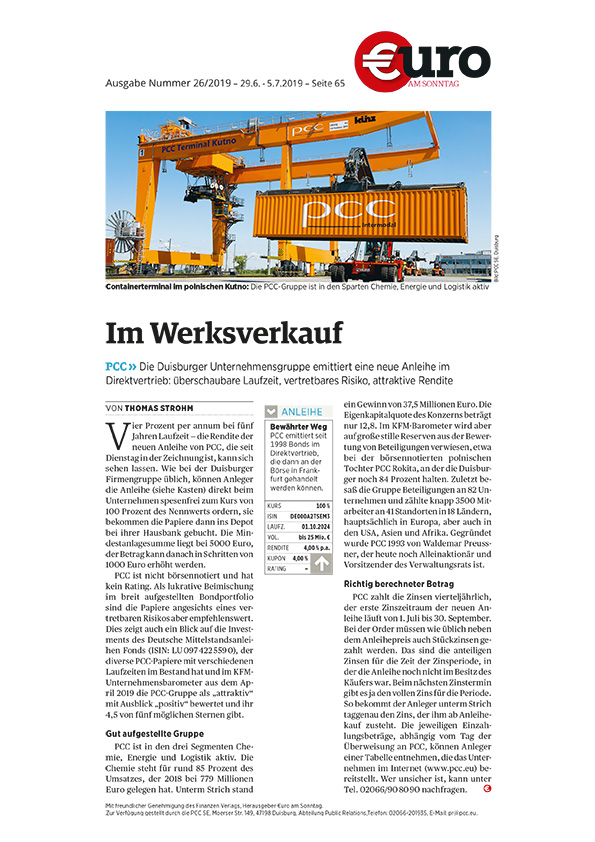
Experienced Issuer: We know what we're doing: PCC has been issuing bonds since 1998 and is one of the most experienced issuers in Germany.
Strong market presence: 20,000 investors have subscribed to PCC securities since our first issuance on October 1, 1998.
Stock Exchange Listing: Do you need your capital back before the end of the term? It's possible to sell bonds through the Frankfurt Stock Exchange.
* Quarterly figures are unaudited. ** The key figures as of 31.12. are taken from the audited consolidated financial statements of the PCC Group in accordance with IFRS, which have been issued with unqualified audit opinions. *** Group comprehensive income is calculated annually.
Key financials PCC SE
PCC SE Key Figures
(according to IFRS)
2024*
2023*
2022*
EBT (€ million)
-11.2
24.6
8.1
Net Loss/Profit (€ million)
-12.2
22.6
8.3
Equity Ratio (%)
56.0
60.2
60.6
Total Assets (€ million)
1,175.5
1,476.1
1,321.9
Fair Value of Investment Portfolio
(€ million)
980.4
1,198.6
1,124.2
- Market Value of All Listed Investments
(€ million) **
348.1
471.0
443.7
Investment Portfolio (Number)
68
66
67
Net Financial Liabilities (Million €)
493.1
525.2
490.8
Investments (Million €)
5.4
22.4
20.8
Employees (as of 31.12.)
76
72
74
Rounding differences may occur.
* Key financials taken from audited separate financial statements of PCC SE prepared in accordance with IFRS and issued with unqualified audit opinions.
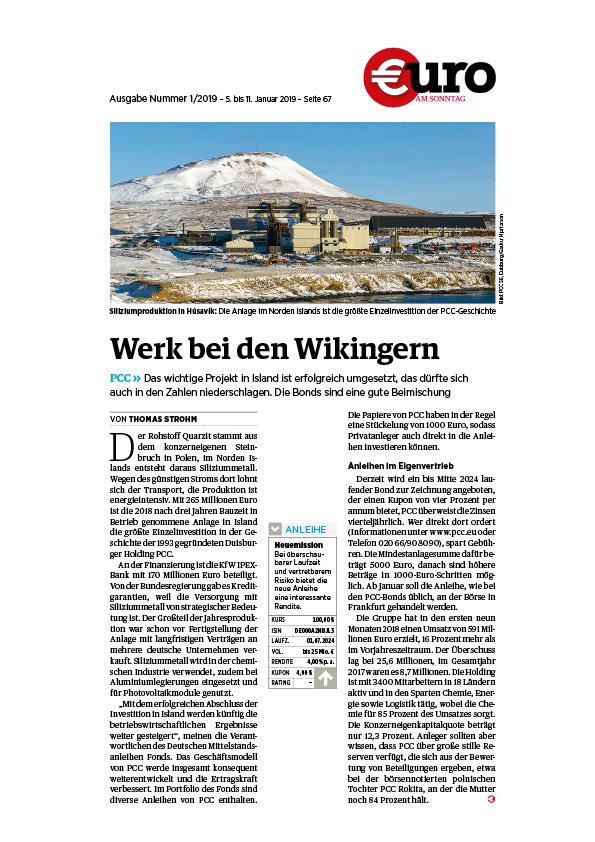
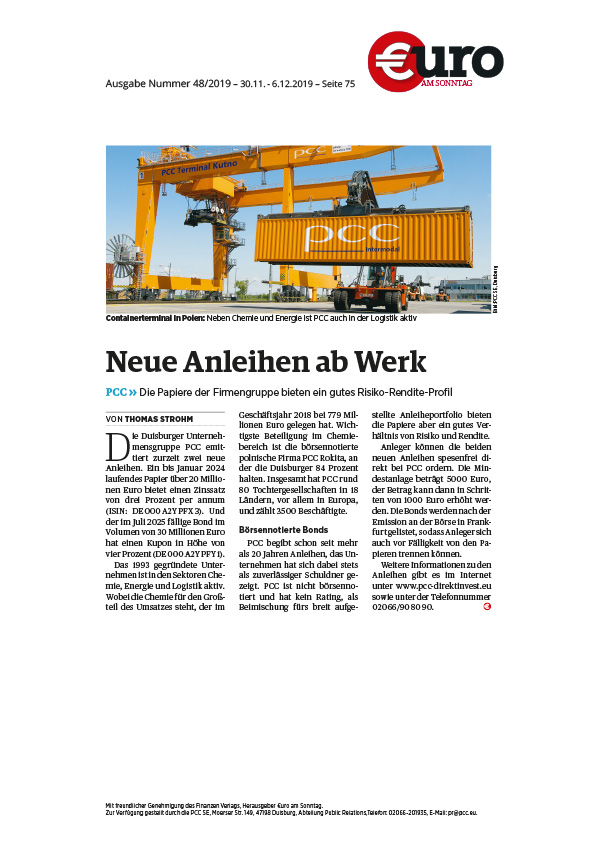
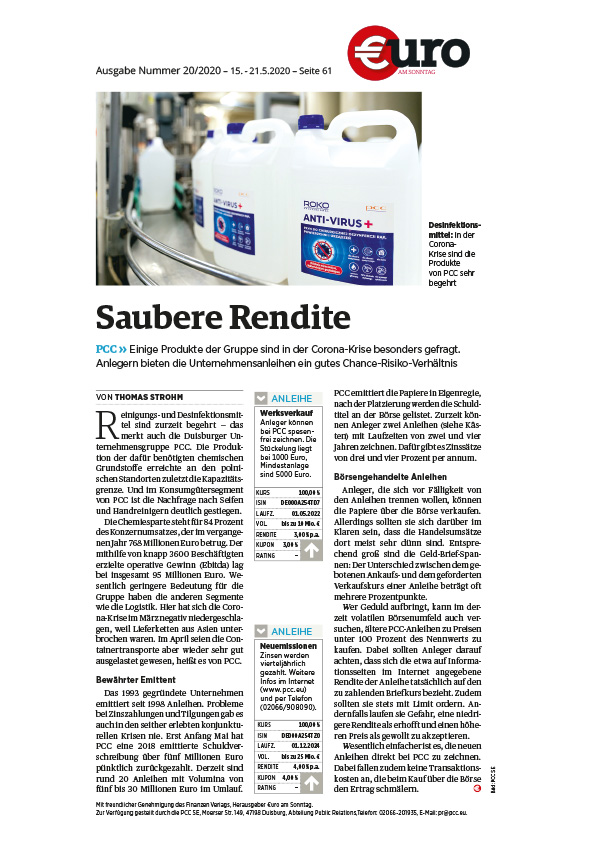
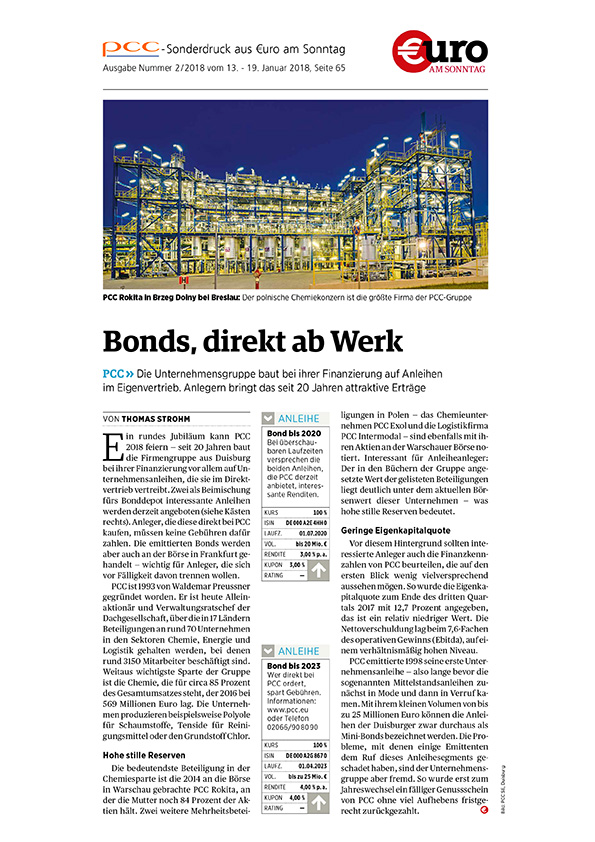
The issuance of bonds has become an important component of PCC’s financing structure alongside financing from banks. True to PCC’s conservative corporate philosophy, the issue volumes are only utilized up to the limit required for the company’s development.